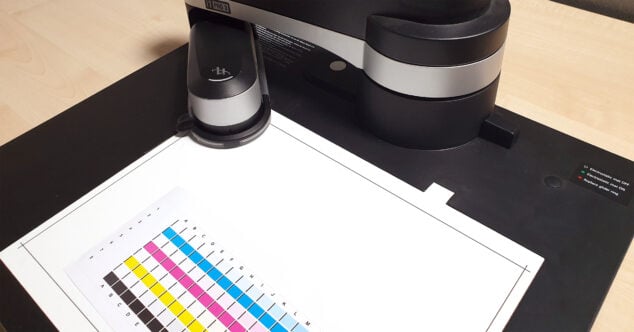
HOW TO MEASURE LINEARIZATION AND PROFILING DIAGRAMS WITH TECHKON SPECTRODENS
If linearization or profiling charts are to be measured with the scan function of the TECHKON SpectroDens, it may happen under difficult conditions that the first or last field of a scan row is read in with a different number of sub measurements. In extreme cases this can lead to inaccuracies in.
…