
In today’s world of digital printing, data is everything – use reports to not only track processes, costs and quality, but also specifically optimized in a targeted manner. ColorGATE offers several reporting functions that go far beyond simple evaluations. In this article, you will learn what reports are available in ColorGATE software and how you can use them efficiently in your workflow.
How ColorGATE’s Reports Make Your Work Easier
ColorGATE reports are structured evaluations of all relevant production data. They help with:
- Quality assurance
- Cost control
- Process optimization
The content of a report depends on the (print) workflow, the type of evaluation/calculation, and the criteria according to which the evaluation/calculation is performed.
Depending on the workflow and objectives, various report types are available:
Use our reports not only to maintain control, but also to actively increase your production output.
Overview of Report Types
Color Control Reports
Objectives and Benefits of Color Control Reports
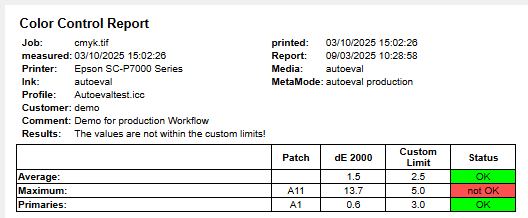
One objective of color control reports is to ensure consistent and reproducible color output. The color control report allows you to analyze the color measurement of a print job and to compare it with defined target values. This allows you to identify and correct discrepancies at an early stage. Clear color expectations and reproducible results are documented as reports, which contributes to transparency for brands and suppliers.
Requirements for Color Control Reports
To generate and print a color control report, you need the Quality Assurance Module. Information about this module can be found on our website. Before you can print a color control report, you need to print and measure a color control wedge with the job.
Data in Color Control Reports
Frequently available data includes:
- User, date, and time of measurement
- Printing conditions such as printer, medium, ink, profile, measurement methods, meta mode
- Target and actual values, tolerances
- Color control results
Output and Handling of Color Control Reports
You can easily create your own tolerances for an in-house standard. You can save, display, and print the result as an HTML report. Printing a color control report on a DYMO label printer is also supported.
You can also print short color control reports on labels (54×101 mm, e.g., for production machines). The advantage is that you can stick the measurement result onto the proof using the label. Thus you have the proof, the control wedge, and the report together on one document. Epson printers can print the control wedge evaluations and the report directly under the job. You can also print complete reports in A4 format, e.g., for certification and quality control.
Proof Evaluation Reports
Objectives and Benefits of Proof Evaluation Reports
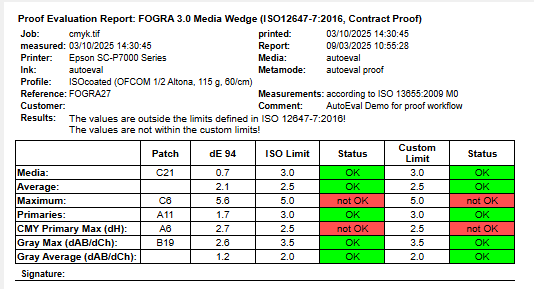
One objective of proof evaluation reports is to verify the consistency between the proof and the printing standard.
The proof evaluation report allows you to compare the print with reference values (e.g., ISOcoated) or ICC-based standards. Ideal for proving color consistency to customers or brand owners.
Requirements for Proof Evaluation Reports
To generate and print a proof evaluation report, you need the Proof Standard Digital Module. Information about this module can be found on our website. Before you can print a proof evaluation report, you need to print and measure a control wedge with the job.
Data in Proof Evaluation Reports
Frequently available data includes:
- User, date, and time of measurement
- Printing conditions such as printer, medium, ink, profile, measurement methods, meta mode
- Target and actual values, tolerances
- Quality control results
Output and Handling of Proof Evaluation Reports
Not only color control reports, but also proof evaluation reports can be saved, displayed, and printed as HTML reports. The output of the report on DYMO label printers is also supported.
You can print short proof evaluation reports on labels (e.g., for production machines). The advantage here is that you can stick the measurement result onto the proof using the label. This means you have the proof, the control wedge, and the report together on one document. Epson printers can print the control wedge evaluations and the report directly under the job. You can also print complete reports in A4 format, e.g., for certification and quality control.
Cost Reports
Objectives and Benefits of Cost Reports
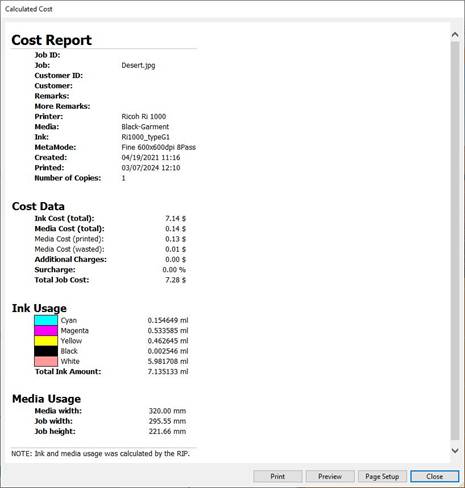
The main objective of a cost report is to provide a transparent overview of printing costs. It offers a comprehensive overview of consumption and production costs as well as job-related expenses such as ink and media costs. It also helps to monitor and analyze all relevant expenses. Create detailed cost reports for specific time periods, printers, or jobs. This allows you to plan your budget before printing the job, identify cost drivers early on, and optimize pricing strategies.
Requirements for Cost Reports
To generate and print a cost calculation report, you need the Cost Calculation Module. Information about this module can be found on our website. It is also required that orders with activated cost calculation have been ripped or printed, so that consumption costs have been determined. To determine the costs accurately, enter the prices of the media and inks used once.
Data in Cost Reports
The Cost Calculation – Cost Report dialog is divided into three tabs: Job Data, Usage Data, and Calculated Costs.
- In the Job Data tab, you can see the information about the job that you entered in the job settings, the loading and printing date, and the selected MIM settings.
- In the Usage Data tab, you can see the exact data on the consumption of printed (printed area) and unprinted media (wasted area) and the total ink (total ink amount) with a breakdown of all color channels (ink quantity per channel).
- In the Calculated Costs tab, you can see the cost result after ripping the job.
Output and Handling of Cost Reports
Under Cost Report, you can display or save a report structured into file information, calculated costs, ink consumption for all channels, and media consumption in CSV Excel table (ccmReport) or HTML format as a detailed job list or overview. You can also output the calculated consumption costs for multiple jobs as a report. A filter is available that can narrow down jobs by time or cost range. In addition, you can also search for job data such as the customer’s name or a specific medium, in which case only matching jobs are included in the report.
For more information on cost control and cost reports, see our blog article Budget security and higher profits through efficient cost control.
Service and Bug Reports – Web Tickets
Goals and Benefits of Web Tickets
Not every report revolves around print data: another area is error management. The so-called “web tickets” submitted to ColorGATE are reports about issues in the software.
These bug reports help the Technical Service team identify problems and fix them promptly − an important part of quality assurance and product development. ColorGATE’s web ticket system offers you and our Technical Service Team transparent tracking of tickets.
Requirements for Web tickets
If you have a valid Value Pack, you are entitled to support. The Technical Support Team fixes bugs in the currently released version and in the previous version, e.g., V25 and V24. This means that bugs in version 23, for example, can no longer be fixed.
You can create a web ticket either directly from the software or via our Service and Support Site. In both cases, you must log in with your access data. For more information on creating a web ticket, check our blog article ColorGATE Web Support – Creating Web Tickets.
Data in Web Tickets
When creating a web ticket, you must enter the following data:
- Your license number
- Summary of your request
- Precise description of your issue
- Attach image files and/or screenshots of error messages and software errors.
- If necessary, enter additional colleagues or partners who should be informed about the problem.
- If requested by our technical support team, provide a support info file. For more information, see our blog article How to create a Support Info File as of Version 23.
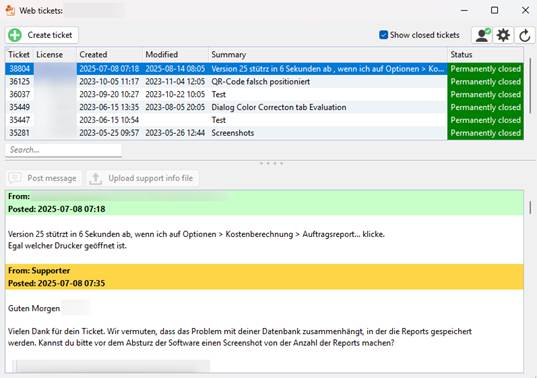
Output and Handling of Web Tickets
You can view the web tickets you have created either directly from the software or on our Service and Support Site.
By selecting or deselecting various filters, you can also decide whether you want to see all open tickets as well as those that have already been closed (Show closed tickets) and whether you want to see all tickets created by other colleagues in your company (Show company tickets).
For more information on managing and issuing web tickets, see our blog article ColorGATE Web Support – Creating Web Tickets.
Conclusion: Smart Reports, Measurable Added Value
Reports enable printing companies to make informed decisions, plan budgets more effectively, and quickly identify—or even avoid—production errors.
With reports from ColorGATE, you can create a reliable database for all relevant areas of your print production – from calculation to quality assurance. They not only provide documentation, but also a real basis for decision-making. The result: greater efficiency, reproducible quality, and a strong competitive position in digital printing. If you would like to learn more about reports or test our reports yourself, please contact us at contact@colorgate.com.